2. Technical Overview and Terminology
This section provides a technical overview and introduces the generic terminology which is used in this document and throughout the Xplain Data software. It also describes how the terms we use relate to terms in other domains.
The following diagram provides an overview of the overall architecture:
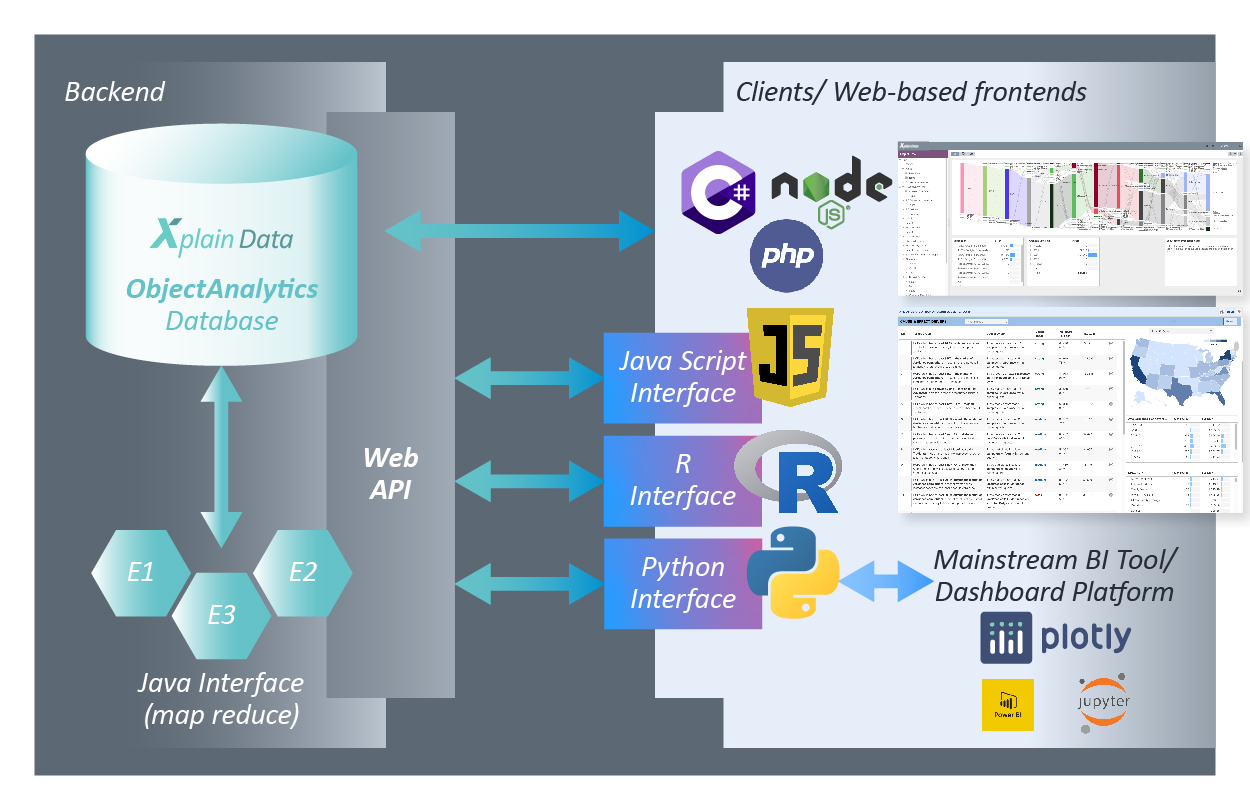
The Xplain ObjectAnalytics core is implemented purely in Java. A Tomcat application server and Spring layer serves for a Web-based interface. Any frontends to the Xplain Data backend are Web-based frontends. You don’t need to install anything when working with Xplain-based frontends. The only prerequisite is an up-to-date browser which is JavaScript enabled.
Session
Connecting to an Xplain server means starting a session. A session holds all information about the current status of the interaction of the user with the system, about data or objects currently loaded for the user, the requests which have been initiated, the computed results etc. Which objects and data are loaded upon starting a session is defined in the “startup configuration” (the starting point of a session, see the corresponding section).
The master of the session is held by the server. A comprehensive replica of the session is provided to the client in terms of a JSON document. In case the client (browser) crashes, it can any time request the session document again from the server to start over again.
As a result of method calls initiated by the client, the status and content of a session changes. As a response to a method call, the session is returned to the client in terms of the JSON document. With this JSON document the client has comprehensive information about the status of a session. It includes meta data about available artifacts (objects, dimensions, attributes … ), meta data about initiated queries and data about computed results - simply everything the client needs to display analytical results to the user. Developers will in general not access the session JSON directly, but typically use the provided JavaScript library or the Python library to access data held in the session JSON.
As the master of the session is held server-side, you may seamlessly switch forth and back between different frontends even during the course of a session. You may, for example, run some Python code against an Xplain Data backend to manipulate a session, e.g., “open” a query, set selections … and at any time the XOE may then be used to visualize the status and content of a session.
Objects, Dimensions and Attributes
The session in particular holds “meta data” information, i.e. about Xplain objects and sub-objects, dimensions and attributes available in the session.
Foremost, there is the “root object” (sometimes also called the “in-focus” object, because the root object is the object in focus of your analysis). It might for example be the “customer”, the “patient”, or the “machine”. The root object is - as the name says - the root of an object hierarchy: it usually has a number of dependent objects, often also called “child objects”, which in turn may have children objects etc.
In addition to child objects, an object has a list of “dimensions”. The most common dimension maps to a corresponding column or field in the source database table. Hence, you may term a dimension also as a “field” of an object. In the world of JSON, a field of a JSON object is rather termed “property”, while the statistician prefers the term “variable” or also “dimension”.
We have decided to use the term “dimension” as kind of the best common denominator. Thereby we do not discern between dimensions and measures in sense of the corresponding terms in the world of Business Intelligence (different sorts of columns in a fact table of a Star schema). Indeed, in the world of ObjectAnalytics there is not much of a need to discern between dimensions and measures; hence, we consistently use the term “dimension” only.
A dimension may have attributes attached to it. An attribute is nothing else but a kind of categorization of the values of a dimension. The dimension “zip-code”, for example, may have the assigned categories “city”, “region” and “country”. Another example of a dimension is “time”, which an attribute may organize into a hierarchy of “months” and “years”. Attributes assign semantics to the raw values stored in a dimension. Attributes extensively support hierarchies.
Statistics Request or Query
To retrieve aggregated statistical information you compose a “request” or a “query”. A statistics request is largely identical to a class of SQL statements. We use both terms for that, “request” or “query”.
Interfaces and Developing New Algorithms and Applications
Technically, the Xplain ObjectAnalytics core is implemented in Java, and a Tomcat application server and a Spring layer serves to provide Web-based access. Beyond that Web-interface, there is also a JavaScript interface to simplify Web development and a (preliminary) Python interface intended to allow data scientists to enjoy ObjectAnalytics. Those interfaces can be used to develop analytical applications beyond the standard Xplain ObjectExplorer.
Beyond developing Web-based applications, you may also want to develop new algorithms and inject them deeply into the Xplain ObjectAnalytics engine for parallel execution. Our Object Map Reduce interface serves that purpose - a Java interface which can be used to define analytical logic on an object (patient) and execute that logic massively parallel for all object instances (e.g. for millions of patients on a server with 128 cores). Basic conceptual information on extending the Xplain ObjectAnalytics engine is given in an additional section. Typically, however, this requires consulting from the Xplain Data team.
Any algorithms which are provided by Xplain Data itself also go via that Object Map Reduce interface. It offers unique capabilities to implement analytical and statistical algorithms on entire objects, not just on flat tables. The Causal Discovery algorithms extensively use that Object Map Reduce interface. Only with that an extensive search for causal factors on large amounts of data is feasible exploiting the computational power of multi-core machines.
Developing and packaging new applications (e.g. in terms of a Docker image) requires specific know-how and in some cases goes beyond the information given in this documentation. Ask the Xplain Data team or partners to help you with development projects.